Peak Force Scattering-type Near-field Optical Microscopy (PF-SNOM)
Near-field microscopy leveraging peak force tapping mode for 3D tomographic imaging with ultra-high spatial resolution.
What is PF-SNOM?
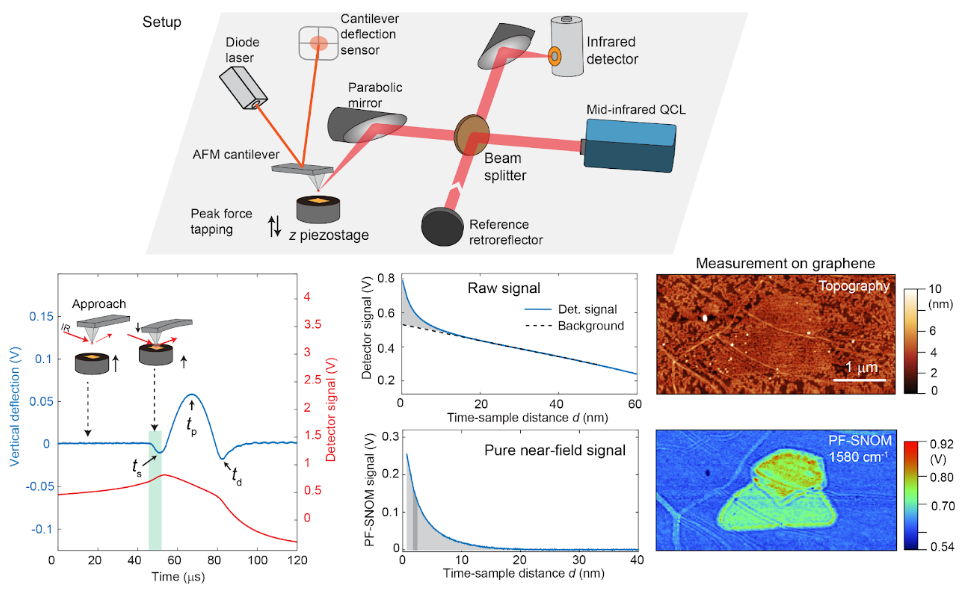
Peak force scattering-type near-field optical microscopy (PF-SNOM) is a type of scattering-type scanning near-field optical microscopy (s-SNOM) that leverages the large tip-sample distance variations of the peak force tapping mode. In s-SNOM, the near-field scattering of the AFM tip is optically detected to deduce the optical properties of the sample underneath. In PF-SNOM, the distance between the AFM tip and the sample can sweep between 0 nm (contact) up to to 300 nm.
The unwanted far-field background (from regions other than the tip apex) is filtered out through a fit from a region of relatively large tip-sample separation, and extrapolated to the close tip-sample distance, and then removed through a subtraction. The net result is a tip-sample near-field signal response with explicit dependence of near-field scattering signal versus tip-sample distance. The details of its operation are described in our paper Nature Communications, 9:2005 (2018).
Ultra-high Spatial Resolution
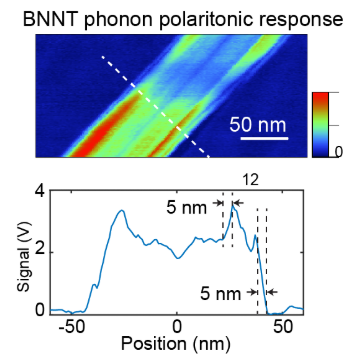
PF-SNOM allows collections of near-field signals at very small tip sample distances, e.g., at 1 nm. Strong field enhancement occurs at such a small distance, usually associated with tight field confinement. We have observed a high spatial resolution of ~5 nm with PF-SNOM from a phonon polariton-active boron nitride nanotube.
Distance-Dependent Spectral Response
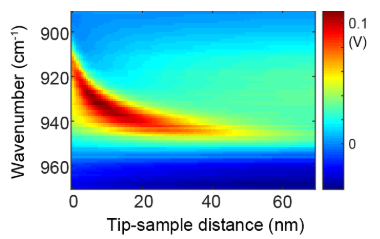
PF-SNOM allows recovery of the spectral dependence on the tip-sample distance. For example, phonon polariton response of SiC exhibits strong red shift between 10 to 0 nanometer tip-sample distance. This distance-dependent spectral information provides unique insights into near-field interactions that are not accessible with conventional s-SNOM techniques.
3D Near-field Response Characterization
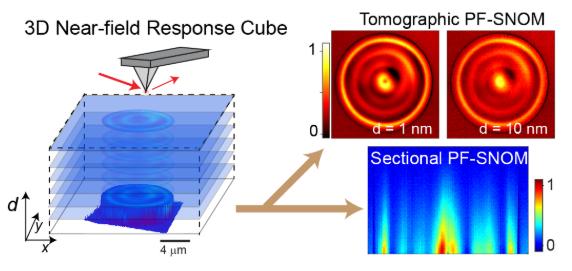
PF-SNOM allows recovery of pure near-field response with explicit tip-sample distance at a spatial location. When combined with the lateral x-y scans of the AFM tip, PF-SNOM allows the collection of three-dimensional (3D) response cube above a sample. The response cubes allow tomographic and sectional analysis along different horizontal planes at different tip-sample distance, or vertical planes across the sample.
Regular s-SNOM with tapping mode AFM does not offer this high level of details of the 3D near-field distributions.
Phonon Polariton Tomography
We have observed an interesting phenomenon about the phonon polaritons in hexagonal boron nitride. The spatial distribution of the polaritonic interference fringes at different tip-sample distances can be quite different. The spatial frequencies (momentum) of the phonon polaritons can be affected by different tip-sample distances.
PF-SNOM tomographic images of phonon polaritons in an edge of h-BN flake show that the interference fringes shift inward at a larger tip-sample distance, indicating lower coupling of momentum.
Standing Wave Modes in Microdisks
PF-SNOM tomographic images of phonon polaritons in an h-BN microdisk at different IR frequencies reveal fascinating behavior. The spatial distributions of polariton interferences at certain IR frequencies remain the same when the tip-sample distance is changed. At other IR frequencies, the spatial distributions of polariton interferences changes with the change of tip-sample distance.
This phenomenon is a manifestation of the emergence of the standing wave mode from geometric confinement. For details, please check our paper Nanoscale, 12, 1817-1825 (2020).
Key Features
- Ultra-high spatial resolution (~5 nm)
- Explicit tip-sample distance dependence
- 3D tomographic near-field imaging
- Far-field background removal
- Compatible with peak force tapping mode
- Phonon polariton characterization
Applications
- Nanoscale chemical imaging
- Phonon polariton studies
- 3D near-field response mapping
- Distance-dependent spectroscopy
- Polariton momentum analysis
- Standing wave mode characterization
Key Publications
View All Related PublicationsProbing Mid-Infrared Phonon Polaritons in the Aqueous Phase
Haomin Wang, Eli Janzen, Le Wang, James, H. Edgar, and Xiaoji G. Xu
View Publication →Three-dimensional Near-field Analysis Through Peak Force Scattering-type Near-field Optical Microscopy
Haomin Wang, Jiahan Li, James, H. Edgar, and Xiaoji G. Xu
View Publication →